


The FENIX s.r.o. production site, as part of the FENIX GROUP a.s. group, is primarily responsible for the manufacture of the ECOFLOOR range of heating cables, ECOSUN radiant panels and, more recently, HES and MES battery storage systems. All production, storage and office premises are heated exclusively by electric radiant heating. The reserved power capacity is negotiated throughout the year within the range of 600–750 kW. The average electricity consumption for the entire site is approximately 3 GWh per year.
A new Energy Centre was built at the FENIX s.r.o. production site in Jeseník at the turn of 2022 and 2023. The aim of the project was to ensure a higher level of energy self-sufficiency and to reduce operating costs at a time when the energy crisis was reaching its peak. The installation of new photovoltaic power plants began in the autumn of 2022. The original installed capacity of approximately 130 kWp was gradually increased during this phase to the current 891 kWp – the panels were installed on open rooftops, as well as on building walls and ground-mounted structures.
In January 2023, a new SAS battery storage system with a total capacity of 2.4 MWh and a power output of 720 kW was also commissioned. The system is housed in two shipping containers and is connected directly to the substation at the site’s main feed-in point. This new storage facility complements the original solution from 2019, with a capacity of just under 600 kWh and a power output of 720 kW, which is installed in the plant room of one of the production buildings and primarily provides backup power for the site, protection against micro-outages and the smoothing of peak demand. The total capacity of the Battery storage systems thus currently stands at just under 3 MWh. The system was designed to maximise the use of the site’s own generated energy directly on-site, in conjunction with the automatic optimisation of electricity procurement and supply on the spot market.
The FENIX Energy Centre is managed by a control system that monitors the current consumption and generation of the photovoltaic plant. At the same time, the so-called spot hourly electricity prices are always loaded for the following day and the solar irradiance forecast is evaluated – based on this information, an algorithm then generates an operational plan that determines the times when the Battery storage system will be recharged from the grid or from surplus PV generation, when the battery will offset the site’s consumption, thereby reducing draw from the distribution network, and when, conversely, the Battery storage system will feed surplus energy back into the grid at a favourable price. The entire process is automated and requires no manual intervention.
| Period | Total consumption (kWh) |
Off-take from the grid (kWh) |
Generation from PV system (kWh) |
Feed-in to the grid (kWh) |
Consumption from the grid (CZK) |
Distribution charges (CZK) |
Feed-in to the grid (CZK) |
Costs of electricity (CZK) |
Achieved price (CZK/kWh) |
|---|---|---|---|---|---|---|---|---|---|
| 01/2023 | 329,000 | 318,432 | 11,000 | 423 | 1,114,069 | 194,619 | 132 | 1,308,556 | 3.98 |
| 02/2023 | 270,050 | 254,054 | 16,040 | 46 | 888,806 | 177,619 | 78 | 1,066,347 | 3.95 |
| 03/2023 | 252,116 | 215,497 | 39,951 | 3,332 | 616,351 | 168,867 | 3,491 | 781,727 | 3.10 |
| 04/2023 | 194,526 | 158,590 | 43,360 | 7,424 | 442,055 | 148,101 | 5,527 | 584,629 | 3.01 |
| 05/2023 | 174,248 | 118,668 | 71,226 | 15,646 | 272,752 | 140,232 | 15,418 | 397,566 | 3.01 |
| 06/2023 | 150,822 | 83,735 | 81,889 | 14,802 | 214,833 | 133,338 | 20,810 | 327,361 | 2.17 |
| 07/2023 | 101,738 | 48,461 | 93,084 | 39,807 | 120,738 | 126,416 | 59,977 | 187,177 | 1.84 |
| 08/2023 | 160,843 | 101,412 | 72,590 | 13,159 | 228,809 | 136,819 | 20,159 | 345,469 | 2.15 |
| 09/2023 | 133,953 | 72,642 | 78,246 | 16,935 | 192,244 | 131,140 | 30,406 | 292,978 | 2.19 |
| 10/2023 | 154,912 | 113,788 | 46,592 | 5,468 | 296,116 | 139,258 | 7,379 | 427,995 | 2.76 |
| 11/2023 | 191,674 | 177,704 | 14,400 | 430 | 444,890 | 178,018 | 489 | 622,419 | 3.25 |
| 12/2023 | 185,807 | 177,997 | 8,510 | 700 | 423,600 | 174,639 | 268 | 597,971 | 3.22 |
| Total | 2,299,689 | 1,840,980 | 576,888 | 118,172 | 5,255,263 | 1,849,066 | 164,134 | 6,940,195 | 3.00 |
Without investment in the Energy Centre (solar power plant, storage facility, active SPOT), electricity costs would have amounted to approximately 14 million CZK excluding VAT (based on consumption of 2.3 GWh and the government-capped price of spot electricity).
The investment costs for the Energy Centre (after deducting a subsidy of 11.5 million) amounted to 45.5 million CZK excluding VAT. For 2023, the annual saving is estimated at approximately 7 million CZK, resulting in a payback period of 6.5 years.
| Period | Total consumption (kWh) |
Off-take from the grid (kWh) |
Generation from the PV system (kWh) |
Feed-in to the grid (kWh) |
Consumption from the grid (CZK) |
Distribution charges (CZK) |
Feed-in to the grid (CZK) |
Costs of electricity (CZK) |
Achieved price (CZK/kWh) |
|---|---|---|---|---|---|---|---|---|---|
| 01/2024 | 267 261 | 256,519 | 10,922 | 180 | 580,004 | 415,675 | 150 | 995,529 | 3.72 |
| 02/2024 | 211,685 | 184,154 | 29,654 | 2,123 | 341,023 | 327,739 | 1,800 | 666,962 | 3.15 |
| 03/2024 | 184,309 | 132,441 | 56,128 | 4,260 | 241,376 | 267,965 | 4,582 | 504,759 | 2.73 |
| 04/2024 | 143,484 | 84,087 | 73,023 | 13,626 | 161,001 | 213,425 | 14,576 | 359,850 | 2.51 |
| 05/2024 | 109,714 | 53,323 | 75,449 | 19,058 | 90,512 | 196,958 | 27,922 | 259,548 | 2.36 |
| 06/2024 | 120,174 | 61,110 | 75,151 | 16,087 | 123,040 | 205,037 | 22,856 | 305,221 | 2.53 |
| 07/2024 | 112,203 | 50,779 | 82,021 | 20,597 | 93,736 | 194,341 | 30,997 | 257,080 | 2.29 |
| 08/2024 | 97,351 | 52,063 | 82,048 | 36,760 | 114,432 | 184,681 | 98,562 | 200,551 | 2.06 |
| 09/2024 * | 100,083 | 71,494 | 38,700 | 10,111 | 137,260 | 202,089 | 16,488 | 322,861 | 3.23 |
| 10/2024 | 221,841 | 217,504 | 41,762 | 37,425 | 503,539 | 332,912 | 88,437 | 748,014 | 3.37 |
| 11/2024 | 272,446 | 247,566 | 24,983 | 103 | 821,258 | 376,742 | 224 | 1,197,776 | 4.39 |
| 12/2024 | 238,894 | 225,515 | 13,908 | 529 | 776,532 | 351,310 | 1,024 | 1,126,818 | 4.71 |
| Total | 2,079,445 | 1,636,555 | 603,749 | 160,859 | 3,983,713 | 3,268,874 | 307,618 | 6,944,969 | 3.34 |
* In September 2024, the data was affected by a high-voltage connection failure caused by flooding; some figures are distorted by communication outages. Power supply from the distribution system was not restored until 12 days later.
Further information here: Case study – Jeseník floods 2024
Prices are quoted exclusive of VAT.
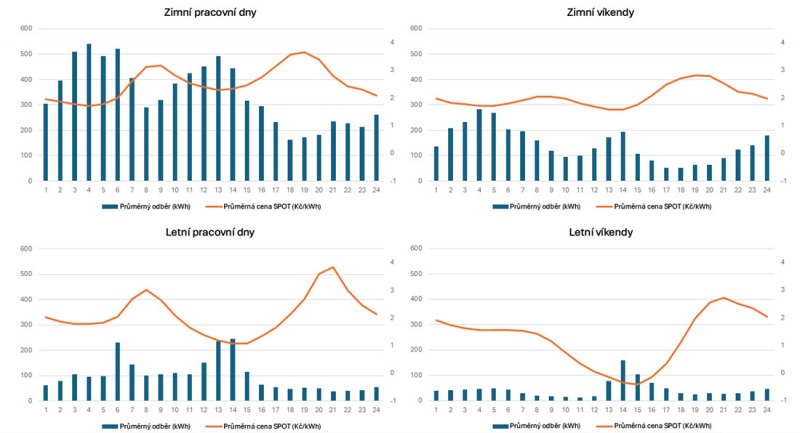
Examples of daily consumption charts for weekdays and weekends during the winter (Jan, Feb, Mar, Oct, Nov, Dec) and summer (Apr, May, Jun, Jul, Aug, Sep) periods of 2024. The graphs show the average hourly consumption in kWh and the average spot price of electricity.
In 2025, there were significant changes to the operation of energy sources at the FENIX site. During the first three months, the Battery storage and the photovoltaic power station were operated in the same way as in the previous year.
From April, a new SAS3 battery storage facility with a capacity of 1,088 kW and 2,400 kWh was commissioned (in the summer of 2025, the capacity was increased to a final 3,000 kWh). The storage facility is designed to provide ancillary services (SVR) for ČEPS via an aggregator. Testing and fine-tuning of the system took place in April, and SAS3 was brought into full operation in approximately mid-May 2025. Within the site, the storage facility is connected, via its own transformer, directly to the 22 kV high-voltage distribution network downstream of the metering point.
The commencement of Ancillary services provision brought about changes to the original operating regime. It was necessary to increase the site’s reserved power input by 1 MW (currently 1.8 MW). The previous reserved power of 0.99 MW is now used exclusively for supplying regulating energy to the grid. At the same time, it was necessary to restrict other supplies to the grid (surplus feed-in from the PV plant and active sales at spot prices).
The new regime has also had an impact on billing. The full amount for distribution is paid, including the volume of regulation energy consumed (aFRR−); regulation energy is deducted only from the volume of active electricity consumed. Supply to the grid (aFRR+) is not included in the feed-in tariff. As part of the remuneration for providing ancillary services, revenues are paid for both capacity reservation and activation.
Total costs for the purchase of electricity in 2025 amounted to CZK 8,392,776 excluding VAT. Revenue from sales to the grid amounted to CZK 35,221 excluding VAT, and revenue from the provision of ancillary services reached CZK 3,647,750 excluding VAT.
| Period | Total consumption (kWh) |
Off-take from the grid (kWh) |
Generation from PV system (kWh) |
Feed-in to the grid (kWh) |
Payments for active power (CZK) |
Payments for distribution (CZK) |
Sales to the grid (CZK) |
Volume of aFRR- (kWh) |
Volume of aFRR+ (kWh) |
Revenue from ancillary services (CZK) (CZK) |
|---|---|---|---|---|---|---|---|---|---|---|
| 01/2025 | 312,309 | 293,549 | 20,041 | 1,281 | 957,288 | 386,493 | 1,553 | - | - | - |
| 02/2025 | 258,983 | 228,664 | 31,193 | 874 | 763,002 | 366,705 | 1,059 | - | - | - |
| 03/2025 | 202,843 | 159,501 | 48,977 | 5,636 | 406,352 | 302,585 | 6,829 | - | - | - |
| 04/2025 | 157,944 | 105,733 | 54,453 | 1,376 | 220,677 | 393,600 | 1,376 | 1,938 | 1,072 | 56,566 |
| 05/2025 | 142,494 | 108,502 | 57,889 | 21,590 | 168,436 | 238,452 | 24,404 | 17,133 | 14,827 | 566,370 |
| 06/2025 | 126,043 | 98,471 | 66,161 | 33,055 | 96,513 | 229,709 | - | 41,722 | 36,187 | 769,860 |
| 07/2025 | 121,411 | 79,542 | 58,080 | 13,610 | 139,160 | 215,446 | - | 17,422 | 14,821 | 408,119 |
| 08/2025 | 119,818 | 70,256 | 67,325 | 15,098 | 92,408 | 208,458 | - | 19,043 | 16,378 | 189,829 |
| 09/2025 | 147,676 | 135,640 | 48,621 | 31,008 | 200,608 | 270,832 | - | 41,132 | 35,550 | 614,319 |
| 10/2025 | 202,351 | 198,749 | 38,098 | 28,428 | 371,134 | 318,372 | - | 42,351 | 36,283 | 639,191 |
| 11/2025 | 262,541 | 248,875 | 24,564 | 9,337 | 667,662 | 382,383 | - | 13,796 | 12,236 | 247,657 |
| 12/2025 | 246,918 | 243,316 | 14,744 | 6,743 | 618,306 | 378,195 | - | 15,572 | 11,173 | 155,838 |
| Total | 2,301,331 | 1,970,798 | 530,146 | 168,030 | 4,701,546 | 3,691,230 | 35,221 | 210,109 | 178,526 | 3,647,750 |
| Period | Total consumption (kWh) |
Off-take from the grid (kWh) |
Generation from PV system (kWh) |
Feed-in to the grid (kWh) |
Payments for active power (CZK) |
Payments for distribution (CZK) |
Sales to the grid (CZK) |
Volume of aFRR- (kWh) |
Volume of aFRR+ (kWh) |
Revenue from ancillary services (CZK) (CZK) |
|---|---|---|---|---|---|---|---|---|---|---|
| 01/2026 | 354,742 | 341,636 | 13,106 | - | 1,046,173 | 309,475 | - | 46,480 | 40,700 | 311,657 |
| 02/2026 | 301,561 | 282,572 | 18,989 | - | 708,276 | 275,401 | - | 34,880 | 30,000 | 170,520 |
| 03/2026 | 277,606 | 222,612 | 54,994 | - | 452,841 | 238,481 | - | 54,140 | 49,390 | 255,932 |
| 04/2026 | 237,571 | 163,059 | 74,512 | - | 256,121 | 222,375 | - | 48,392 | 43,054 | 256,024 |
| 05/2026 | 204 560 | 143 568 | 60 993 | - | 191 418 | 203 015 | - | 58 500 | 52 190 | 224 013 |
| 06/2026 | 201 993 | 132 380 | 69 613 | - | 185 144 | 199 993 | - | 53 000 | 46 200 | 298 976 |
| 07/2026 | 191 132 | 126 444 | 64 688 | - | 202 566 | 198 387 | - | 54 950 | 53 010 | 245 215 |
| 08/2026 | 161 912 | 118 384 | 43 528 | - | 262 409 | 196 209 | - | 49 470 | 45 450 | 250 422 |
| 09/2026 | - | - | - | - | - | - | - | - | - | - |
| 10/2026 | - | - | - | - | - | - | - | - | - | - |
| 11/2026 | - | - | - | - | - | - | - | - | - | - |
| 12/2026 | - | - | - | - | - | - | - | - | - | - |
| Total | 1 931 078 | 1 530 654 | 400 424 | 0 | 3 304 948 | 1 843 336 | - | 399 812 | 359 944 | 2 012 759 |
> 85,000 m² of cable mats
supplied each year
Manufactured in Europe
Trusted Globally in 70+ Countries
Register your product
to receive a lifetime warranty on our heating cables and mats
Each of our solutions
has been proven in practice